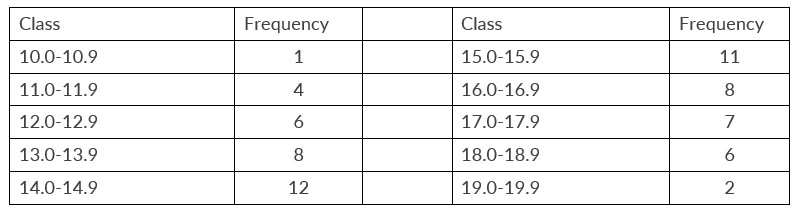
The frequency distribution below represents the weights in pounds of a sample of packages carried last month by a small airfreight company.
- Compute the sample mean
- Compute the sample mean using the coding method with 0 assigned to the fourth class
- Repeat part (b) with 0 assigned to the sixth class
- Explain why your answers in parts (b) and (c) are the same
Solution
a.

b.

c.

d.


